Scientific Write-Up
Materials and Methods
To conduct this study, Eastern Box Turtles were captured in various valleys around the Denny Field in the Eastern part of Lovett’s Campus. For instance, this year 11 box turtles were captured. The valley in which the box turtle’s that were found were marked so that the turtle’s could be released into their native habitat. Once the turtles were back in the classroom, each of the four separate groups were assigned a box turtle, which they would be working with until November. Baseline data was then collected for each turtle. These measurements included dimensions of the turtle, weight, and shell pattern pictures using Haglof Mantax Blue calipers, a iPhone 6 smartphone, and a scale. Each turtle was sexed and identified based off unique personal shell patterns compared to a list of turtles captured in the previous 10 years. Once all baseline data and turtle identification was complete, SOPR-2190 research transmitters were attached securely to the carapace, the top shell, of the turtle using velcro and camo duct tape. The turtles were later released back in their native capture spots. When going to search for a turtle, a Wildlife Materials, Inc TRX-16S receivers with Model FJ51-3FB antenna attached to it. The corresponding channel of the transmitter is tuned into the receiver so it only gathers one signal. With the attenuator on, the researchers head to the valley in which the box turtle was found and turn on their telemetry equipment. They scan the forest slowly turning the gain down until they have made visual contact with their turtle. A colored ribbon with the date and name of the turtle is tied around the nearest tree. Photographs are taken of the turtle in its surroundings. A telemetry data sheet is filled out describing the state of the turtle, location, and the names of the researchers on the hunt.
Results
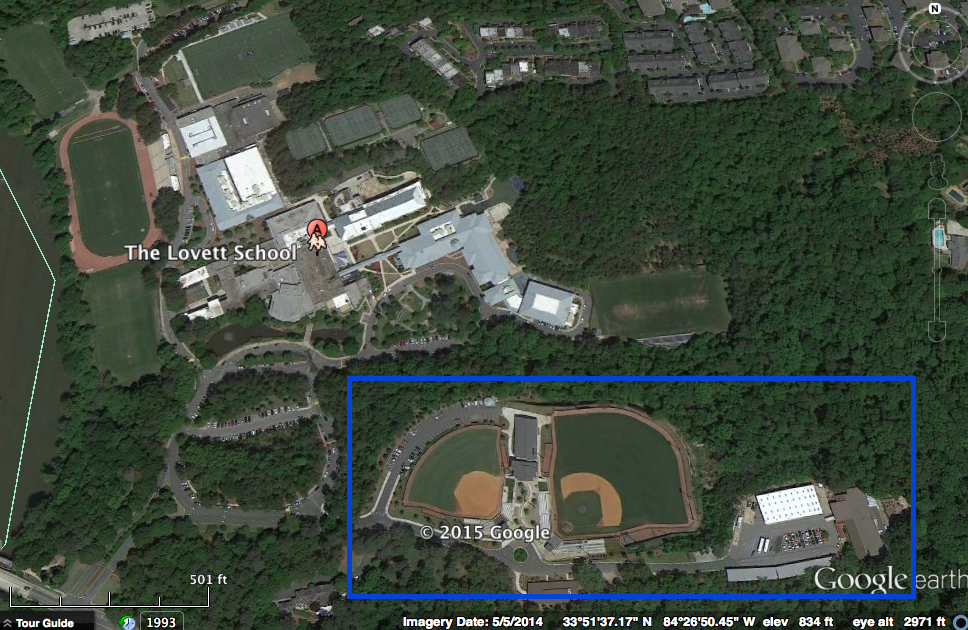
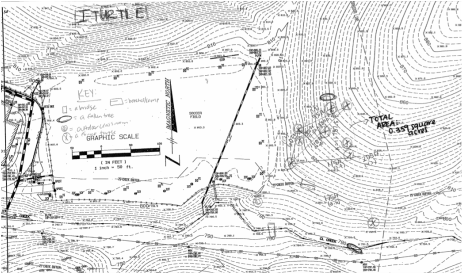
The results of the study over the previous years are displayed in the graphs below. Figure 1’s pie chart of the male to female ratio shows that there are more males than females within the total Lovett box turtle population. Figure 2 shows the number of new turtles captured per year and displays a gradual decline in captures from 2005 to 2015. Figure 3 displays a table of individual turtles and their number of times recaptured. Jewel was recaptured five times making her the most recaptured female and Oaky was the most recaptured male, since he was recaptured 6 times. Figure 3 also includes a graph representing a fluctuating amount of recaptures between 2005 to 2015 per year. 2013 has 13 captures, which is the highest amount in the study, while 2006 has the lowest with only 1 recapture. Figure 4 represents the overall 2015 study as a whole, displaying the 11 total males and females captured and 8 recaptured specifically in 2015. Figure 5 displays the study area population estimate and the work required to obtain the population estimate of 115.07 box turtles. Figure 6 is two gender separated tables evaluating the sexual dimorphic measurements of the box turtles, displaying the males greater average in weight (g), length (cm), width (cm), and depth (cm) than females. Figure 7 shows the various shell patterns among eastern box turtles on Lovett’s campus. 16 male box turtles have a spotted shell pattern, which is the most frequent type of shell pattern for male box turtles, while solid, striped, and spotted are tied with 9 box turtles each with the largest amount of females Figure 8, in table form, and figure 9, in a bar graph, display a greater average in female home ranges, 0.828 acres than male home ranges, 0.724 acres. Figure 10 analyzes the home range sizes in different valleys, displaying a maximum home range of 5.38 acres in Rainy Day Valley for males and 1.29 acres in Intermittent Valley for females. Figure 11 goes farther than figure 10 and compares the number of turtles captured in each valley. The Hidden Valley proved to have 19 captured box turtles, which was the highest total amount of box turtles and included 13 males, which is the largest amount of captured males. As shown in the table and graph, the greatest amount of female box turtles captured was 8 in Intermittent Valley. Figure 12 displays satellite images of Hidden Valley, the best habitat based on number of finds, and the baseball fields at The Lovett School, which represents the box turtles’ fragmented habitat. Figure 13 reports the 16 total rescued box turtles from the baseball field construction, and the slightly larger amount of females, 9, than males, 7, rescued. Only a small amount of 9 from the 16 have been found since the rescue. The rescued turtles’ new home ranges since the rescue are also displayed with the largest new home range being Latisha’s 1.63 acres. Figure 14 is I-Turtle’s personal home range map on satellite, while figure 15 displays her home range on a topographical map. Through geometric breakdown, I-Turtle’s home range was determined to be 0.359 square acres.
Figure 1: Population Statistics

1. Total number of male and female turtles captured in study
a. 41 males
b. 36 females
2. Total number of box turtle’s captured in length of study
a. Total = 77 box turtles
3. Ratio of male to female
a. 41:36
a. 41 males
b. 36 females
2. Total number of box turtle’s captured in length of study
a. Total = 77 box turtles
3. Ratio of male to female
a. 41:36
Figure 2: Number of new captures per year
4a. 2005: 10 males and 5 females 2011: 3 males and 2 females
2006: 4 males and 3 females 2012: 3 males and 0 females
2007: 8 males and 6 females 2013: 1 male and 6 females
2008: 5 males and 5 females 2014: 1 male and 0 females
2009: 1 male and 5 females 2015: 1 male and 2 females
2010: 4 males and 2 females
2006: 4 males and 3 females 2012: 3 males and 0 females
2007: 8 males and 6 females 2013: 1 male and 6 females
2008: 5 males and 5 females 2014: 1 male and 0 females
2009: 1 male and 5 females 2015: 1 male and 2 females
2010: 4 males and 2 females

|

|
Figure 3: Individual turtles and their number of times recaptured

|

|
Figure 4: 2015 Study
6. Total number of male and females captured in the 2015 study
a. 2015: 3 captured: Squirt, Matrix, and I-Turtle
Total number of box turtle's captured in length of 2015 study
a. 11 total box turtles captured
7. Number of recaptures in 2015
a. 2015: 8 recaptured: Rocky Top, Killer, Carrot Top, Billy Peebs, Biggie Smalls, Spike, and Precious
a. 2015: 3 captured: Squirt, Matrix, and I-Turtle
Total number of box turtle's captured in length of 2015 study
a. 11 total box turtles captured
7. Number of recaptures in 2015
a. 2015: 8 recaptured: Rocky Top, Killer, Carrot Top, Billy Peebs, Biggie Smalls, Spike, and Precious
Figure 5: Study area population estimate
8a. 115.07 box turtles (work shown below)
(Number Captured) (Number Marked)
Number Recaptured
(Total number of turtles found from 2005-2013 +1) (Total number captured in 2014+1) (67+ 1) (21 + 1) = 1496 Population Estimate = 115.07
(# of marked recaptures in 2014 – 1) (14-1) 13
(Number Captured) (Number Marked)
Number Recaptured
(Total number of turtles found from 2005-2013 +1) (Total number captured in 2014+1) (67+ 1) (21 + 1) = 1496 Population Estimate = 115.07
(# of marked recaptures in 2014 – 1) (14-1) 13
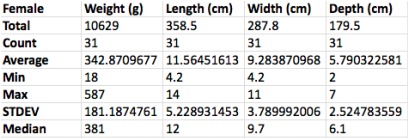
Figure 6: Sexual Dimorphism
1. Sexual Dimorphic measurements
|

|
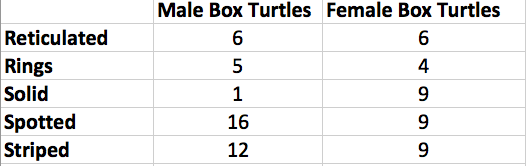
Figure 7: Shell patterns – how many of each type
|

|
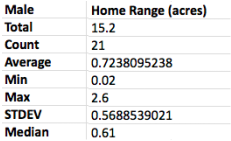
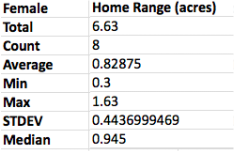
Figure 8: Home range sizes (Male vs. Female)
|
|
|
Figure 9: Home range sizes cont.

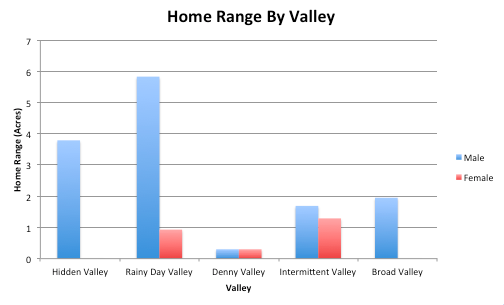
Figure 10: Home range sizes in different valleys
|

|
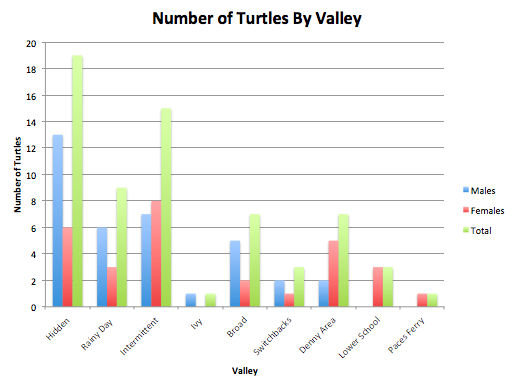
Figure 11: Number of turtles captured in each named valley
|

|
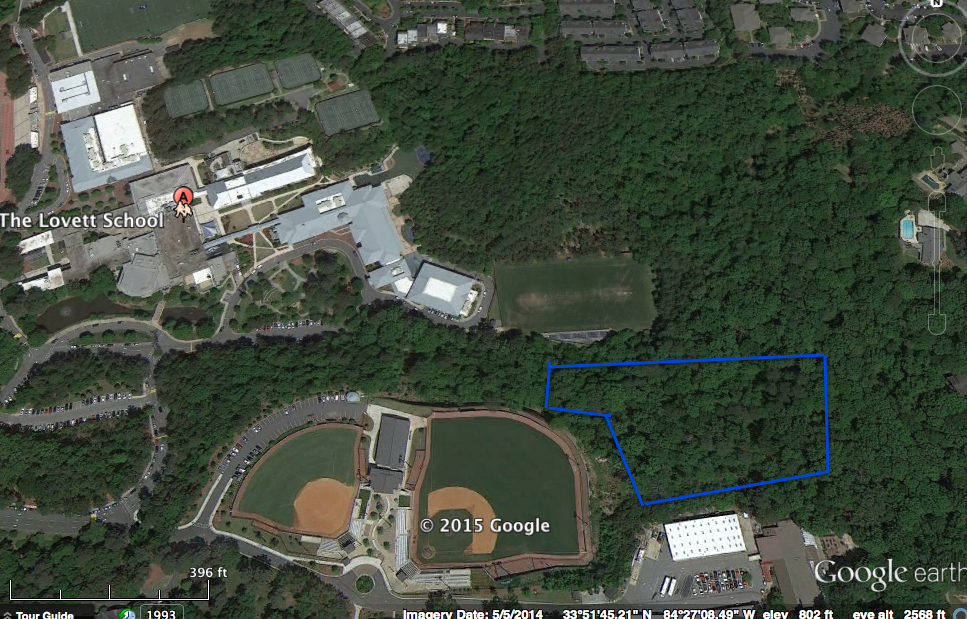
Figure 12: Satellite images
|
3. Satellite images referencing best habitat (Hidden Valley) based on number of turtle finds
|
4. Satellite images referencing fragmented habitat
|
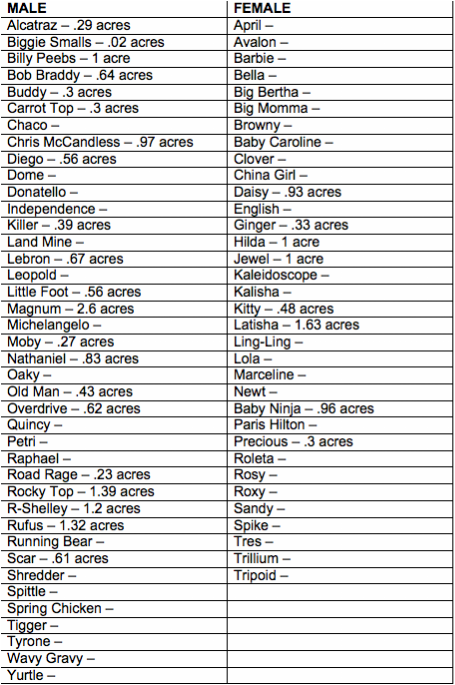
Figure 13: Rescue and Repatriation
|
1. Data based on BT’s rescued from baseball field construction.
a. Total rescued: 16 Rescued: 9 females and 7 males Females: Avalon, Barbie, Bella, Daisy, Jewel, Kaleidoscope, Kalisha, Latisha, Ling-Ling Males: Bob Braddy, Diego, Donatello, Leopold, Oaky, Raphael, Running Bear Total found since rescued = 4 females 5 males Females: Avalon, Daisy, Jewel, Latisha Males: Bob Braddy, Diego, Donatello, Oaky, Running Bear b. New home range size/ location relative of old home range |

|
Figure 14: Home range and geometric break down for I-Turtle |
Figure 15: Scanned image of your topographical map showing home range |

|
|
Introduction
In 1961, The Lovett School opened its first school year at 4075 Paces Ferry Road. With the late 60s, 70s, and 80s came aggressive construction projects bringing the campus Kilpatrick Stadium, Loridans House, Smith Natatorium, Vasser Woolley Library, and more. As Lovett has continued to urbanize, the box turtle population has slowly diminished. For years, box turtles have existed in the south eastern valleys of the campus. The population of box turtles took a major toll in 2010 when Lovett began construction of baseball fields in the southern portion of of the south eastern valley. Since then, box turtles have been relocated to live between the newly implanted baseball fields and in the Denny Field, where other box turtles were already residing.
Lenore Fahrig completed a similar study on the negative effects of box turtle habitat fragmentation. The study proved that patch fragmentation is most harmful to box turtles and occurs when certain species are separated into patches with matrices of human influence in between. This is identical to what occurred on the Lovett’s campus when considering the addition of the baseball complex in 2010, which completely split the habitat of box turtles. The study predicted that with the continuation of patch fragmentation, box turtle population size will decrease significantly.
With all of Lovett’s new additions such as the Murray Athletic Center, the Portman Family Middle School, Bill Railey Turf Field, and many other additions, box turtles are left with approximately 11.5 square acres. Along with this area, box turtles survive on a hillside north of this valley and east of the valley. An average box turtle requires an area of about 0.0172 square acres in diameter and approximately 9.2 square acres to survive and thrive, but many box turtles are able to survive within this area due to box turtles’ overlapping home ranges. At this point, Lovett does not obtain nearly the proper amount of living space for the box turtle population. This put the box turtle population in severe danger with limited food sources, living space, and increased exposure to predators. Habitat fragmentation occurs when a population of a species slowly deteriorates. The Lovett School was a prime example of habitat fragmentation as the increased urbanization and construction continuously caused harm to the box turtle population.
Box turtles are key assets to a healthy ecosystem. Box turtles provide a balance within the food web as omnivores that feed on many poisonous species such as poisonous mushrooms, insects, snails, earthworms, and types of carrion such as squirrels. Predation controls population sizes and prevents species in a specific ecosystem from exceeding carrying capacity. The box turtle provides assistance in the species richness of an ecosystem. Richness in specific species is important to maintain because it is directly related to an ecosystem’s efficiency and rate of production. Not only are box turtles specifically beneficial to the Lovett community, they are beneficial to nation-wide ecosystems as well. However, there have been many cases of habitat fragmentation of box turtles on the Lovett School campus and globally as well.
The goal of the Lovett school study was to collect baseline data to compare the Lovett box turtles to other healthy box turtles. In doing so, the group estimated population size, home ranges, identified overall health of box turtles’ population, and finally, investigated the overall impact humans have on box turtles’ survival and the impact of habitat fragmentation on the box turtle.
Discussion
The data collected throughout this study has provided baseline information regarding the overall health and home ranges of the Lovett School’s box turtle habitat. More specifically, the number of box turtles captured each year, the number of recaptured box turtles per year, sizes of home ranges, home range sizes in different valleys, and the number of turtles captured in each named valley were all recorded in order to properly assess the overall health and home ranges of the box turtles. From this data provided, the impact of habitat fragmentation on the box turtles becomes evident. This data is very important in that it provides a deeper understanding of human impacts on the box turtle habitat in the Lovett School (especially habitat fragmentation).
Figure 1 provides insight into the number of box turtles captured throughout the study, categorized by males and females. In totality, a total of 77 box turtles have been captured, 41 male and 36 females. This information is significant in addressing the ability of box turtles to reproduce. There are less females than males, making it possible for the box turtle’s ability to reproduce increase. This is due to Females ability to mate with more males, allowing for greater reproductive success, since females are capable of having eggs four years following a single mating. Another significant anecdote includes the fact that female box turtles should have greater home ranges than males. Females need more room to reproduce and to lay their eggs. However, due to the cooling of temperatures, since this study was done in the fall, females are less motivated to move and are preparing to settle for hibernation. Therefore, they are most active and ready to reproduce in the spring when there are warmer temperatures.
Figure 2 provides information on the number of box turtles newly captured per year. As the graph portrays overall, this number gradually declines. In 2005, ten male and five female box turtles were newly captured, whereas in 2015, there was one male and two female box turtles. There are many influences that contribute to the decline in newly captured box turtles, in particular habitat fragmentation. As mentioned in the introduction section, Lenore Fahrig completed a study on the effects of patch fragmentation of box turtles. Patch fragmentation occurs when certain species are separated into “patches” with “matrices” of human influence in between each patch. This fragmentation of box turtles directly affects box turtle populations in a negative way. When box turtle habitats are being replaced by urbanization or other human influences, the turtles struggle with finding a new habitat to adapt, and in doing so, their likelihood of dying often increases. Though there is an overall decline in the number of box turtles newly captured, there are still new box turtles being captured each year. This is significant, since Lovett treats this study as a closed system, when the addition of new box turtles could symbolize Lovett being a more open than closed system.
Figure 3 portrays the number of recaptured turtles per year. As the graph and table demonstrate, the number of box turtle recaptured per year fluctuates, and are generally pretty high. The year 2013 has 13 captures, which is the highest amount in the study, while 2006 has the lowest with only 1 recapture. The data provided informs the reader that certain areas of the data may be skewed because some turtles, presumably living in the same home range, were used more than once in the study and played a bigger role in determining the average home range, even though the turtles may not have been more representative of the population as a whole.
Figure 4 primarily focuses on the 2015 box turtle study. It shows that three turtles, Matrix, Squirt, and I-Turtle were newly captured this year in our study. Eight turtles were recaptured this year in the study. The number of recaptures is higher than the number of new captures, showing that Lovett’s box turtle habitat is sufficient for box turtles to survive. The higher number of recaptures also proves that Lovett’s box turtles have not been moving far or at great speeds, mainly due to the fact that there has not been much of a need to move.
Figure 5 displays collected data from the total number of turtles captured from 2005 through 2015, a population estimate that approximately 115 box turtles are present on the Lovett campus. In doing so, the number of turtles captured from 2005 through 2013 (plus one) was calculated and multiplied by the number of turtles captured in 2014 (plus one). That came to a total of 1496. This number was then divided by the number of marked recaptures in 2014 (minus one), which made the calculation end up being 115.07, the approximate estimate of the total number of box turtles throughout this study. The population estimate provides data that is essential for knowing how the population has altered over the years and future population trends, since the population estimate increasing displays a growing reproductive population, which will lead to an increase in population growth.
Figure 6 shows the sexual dimorphic measurements for both male and female box turtles. Male box turtles tend to weigh more with an average weight of 366.6g than female box turtles with an average weight of 342.9g. However, several very small female box turtles were captured skewing their mean weight to the left. The largest turtle captured on Lovett’s campus was 587 grams and it happened to be female. Male box turtles have length (cm), width (cm), and depth (cm) averages of 12.3, 9.8, and 5.8, respectively. The female box turtles come in just slightly smaller in each category with average length (cm), width (cm), and depth (cm) being 11.6, 9.3, and 5.8. Male and female box turtles tend to be around the same size and the difference in Lovett’s data is likely due to capturing a few new born female box turtles, which causes the average size to be smaller.
Figure 7 shows the various shell patterns among eastern box turtles on Lovett’s campus. Reticulated shell patterns occur 6 times in both the 36 male box turtles as it does in the 31 female box turtles. The rings shell pattern is slightly more common in male box turtles with 5 occurrences as opposed to 4 occurrences in female box turtles. The solid shell pattern is much more common in female box turtles than in males with 9 females containing solid shells compared to only 1 male. Spotted shell patterns are more common in male box turtles where it occurs 16 times as opposed to 9 times in females. Striped shells are just slightly less common in female eastern box turtles where they occur 9 as opposed to 12 times in males. The colors and patterns of box turtles’ shells are significant because it how box turtles blend into their environment and protect themselves from predators.
Figure 8, in table form, and figure 9, in a bar graph, display home range sizes separated by gender. As shown in both figures, there was a greater average in female home ranges, 0.828 acres than male home ranges, 0.724 acres. This difference in home range could be a result female’s need for more space associated with mating and nesting. Although it is difficult to compare during the Fall, because often female box turtles’ home ranges are significantly larger than males in the Spring months due to mating patterns. A similar study done by Neil P. Bernstein on home range and philopatry in the Ornate Box Turtle, Terrapene ornata ornata, in Iowa was conducted to study to analyze the difference between male and female home ranges within a fragmented habitat, just as the Lovett School is. The study’s results determined the female’s movement and home ranges increased in May and June then decreased in the months of July, August, and September due to high mating productivity within the Spring months. Their study agreed with Lovett that monthly, just as shown in the Fall months, the average home ranges of males and females do not differ by much, but their study did differ from Lovett’s when considering the maximum average home range by year with males having an overall larger home range. Lovett was unable to get an average yearly home range due to the study only being during the Fall months.
Figure 10 shows how male and female box turtles differentiate in home ranges. On average, male box turtles have a home range size of approximately 2.7 square acres, whereas the female box turtles have an average of about .5 square acres for their home range. As discussed earlier, in the fall months, females’ home ranges are smaller due to their lack of motivation to move about and search for reproductive space. In contrast, Kenneth B. Raposa performed a study on Rhode Island Box Turtles’ home ranges, which vary from .54 acres to .83 acres. The home range of Lovett box turtles is somewhere in that general range, however this study shows that Lovett has an abundance of necessities in certain home ranges for box turtles to survive and reproduce. According to Raymond B. Iglay’s study of Eastern box turtles, turtles travel in search of mates and of food and water. Lovett’s abundance of resources in habitats prove that turtles do not need to move far in order to retain proper resources, unless a box turtle’s home range is lacking in providing these resources. For example, Lovett’s Denny Valley has a very low home range for both male and female turtles. This means that turtles living in Denny Valley have trouble finding resources to survive, whereas turtles living in Hidden or Rainy Day Valley have easier access to more abundant resources.
Figure 11 demonstrates the number of turtles captured in each named valley. As this bar graph portrays, Hidden Valley, with a total of 19, has the highest total number of turtle captures followed by Intermittent Valley with a total of 15 turtle captures. This data collected provides insight into the quality of each valley, and which valley is the most habitable and adapt environment for box turtles to survive and thrive in, meaning Hidden Valley and Intermittent Valley have the most abundant resources such as food and water. It is possible that Intermittent Valley could have had a more abundant amount of box turtles, but many of them were relocated due to the construction of the baseball fields. According to a study performed by Raymond B. Iglay of Eastern box turtle movements in a fragmented landscape, the best possible habitat for any box turtle is one with an abundance of food, water, and a brush so that the turtle may properly hibernate and camouflage. In conclusion, the data collected assumes that Hidden Valley has the greatest abundance of food, water, and brush so that a box turtle may survive and thrive in that particular habitat.
Abstract
A. What are the objectives of this study?
The objective of this study was to observe Eastern box turtles’ home ranges at the Lovett School. Through the observations of their movement and distribution, insight was gained on box turtles’ population and the effects a changing environment and human impact have had on its population and home ranges over time.
B.How was the study done?
Every year 4 Eastern box turtles on Lovett’s campus are tracked at minimum once a week throughout the Fall. The turtles were found using telemetry. Before tracking the turtles their baseline data was recorded which includes shell dimensions, weight, and gender. Once all data was collected, research transmitters were attached securely to the carapace of the turtle using velcro and camo duct tape. The turtles were then released back in their original capture sites. Each time a turtle was found, a telemetry sheet was filled out describing the find and the location was marked by a ribbon on the closest tree. At the end of approximately three months, the box turtle’s home ranges were calculated using data from previous finds. The locations of each find were labeled on a map and the home range was extrapolated from the distance between find locations. Each year all of the box turtle telemetry studies are accumulated into a conglomeration of studies from the past 10 years making it easier to analyze trends in the population.
C. What results were obtained?
After tracking the box turtles for approximately four months, the results of the ten year Lovett study displayed that Lovett was capable of sustaining a stable box turtle population, while also keeping the turtles healthy. This data collected throughout the study led us to establish the overall population density, home range size, and population growth of Lovett’s box turtle population. From what we have observed, the turtles have displayed a low death rate and the ability to reproduce and survive within the environment through all the years of research, even though Lovett’s development of the Baseball facilities has minimized their home range and caused further habitat fragmentation.
D. What is the significance of the results?
The results of the box turtle study were significant because throughout the many years this study has been completed, gradual changes within the Lovett environment and its effects on box turtles can be observed. The low death rate viewed within the results were significant because it shows that the box turtles were surviving through the constant changes at The Lovett School, even though their home ranges were decreasing, which was important when considering population growth in future urbanization and developing conservation strategies for the species. As the turtles home range’s grow closer and closer to human activity more box turtles’ lives will be put at risk due to construction, roads, and buildings, which Lovett’s increasingly growing aware of due to this study. Lovett’s best options for future construction and conservation of the box turtles is to begin to build up and onto existing buildings, rather than out within the box turtle and other animals homes.
Title: Eastern Box Turtle (Terrapene c. carolina) Home Range Study within The Lovett School’s Fragmented Habitat
Literature Cited
1. Bernstein, Neil P., et al. “Home Range and Philopatry in the Ornate Box Turtle, Terrapene
Ornata Ornata, in Iowa.” American Midland Naturalist 157.1 (2007): 162-74. JSTOR.
Web. 3 Dec. 2015. <http://www.jstor.org/stable/4500603>.
2. Fahrig, Lenore, Alexandra Dorland, and Trina Rytwinski. Do Roads Reduce Painted Turtle
(Chrysemys Picta) Populations? San Francisco: PLOS One, 2014. PLOS One. Web. 3
Dec. 2015. <http://www.plosone.org/article/Authors/info:doi/10.1371/journal.pone.0098414>.
3. Iglay, Raymond B., Jacob L. Bowman, and Nathan H. Nazdrowicz. “Eastern Box Turtle
(Terrapene Carolina Carolina) Movements in a Fragmented Landscape.” Journal of
Herpetology 41.1 (2007): 102-06. JSTOR. Web. 3 Dec. 2015.
<http://www.jstor.org/stable/4498557>.
4. Raposa, Kenneth B., and Thomas E. Kutcher. Home Range and Habitat Use Patterns of Eastern
Box Turtles (Terrapene Carolina Carolina) on Prudence Island, Rhode Island.
Narragansett Bay: Narragansett Bay Research Reserve, 2007. Print. Technical Report
Series.
